Quantification of soil carbon
inputs under elevated CO2: C3
plants in a C4 soil
Photo album
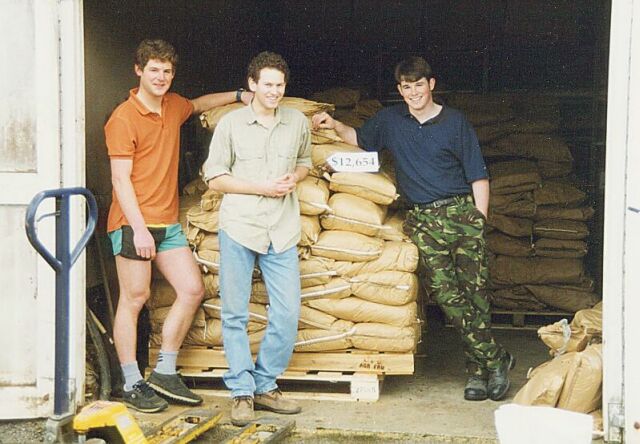
8 tons of soil from the Konza
prairie in Kansas arrive in Lancaster.
The soil was sterilised before being
shipped to avoid introducing new pests or pathogens
into the UK and needed to be put in 'quarantine'
until given the green light by the authorities.
This soil has developed under a grassland
community that is dominated by so-called C4-plants.
These plant species have a different
ratio of two stable carbon isotopes, C-12 and C-13,
in their tissues (and therefore in their
recalcitrant organic residues that slowly accumulate
in the soil over the millenia) than the
so-called C3-plants.
The tree species in our experiment are
C3-plants like all trees.
The change in the ratio of C-12 to C-13
in the soil during the experiment allows us to quantify
the carbon flux from these young trees
into the soil even though the extra carbon input is minute
compared with the carbon content of the
soil.
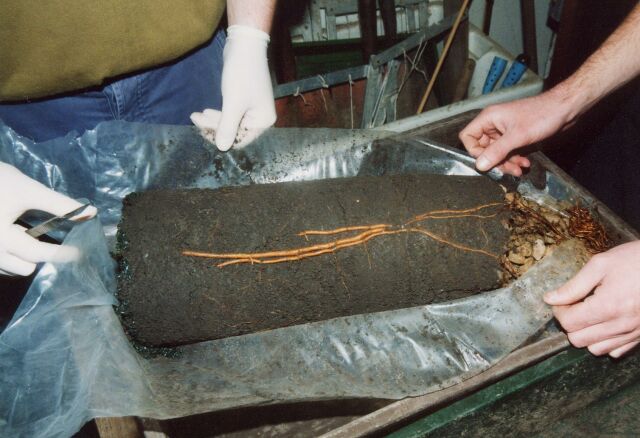
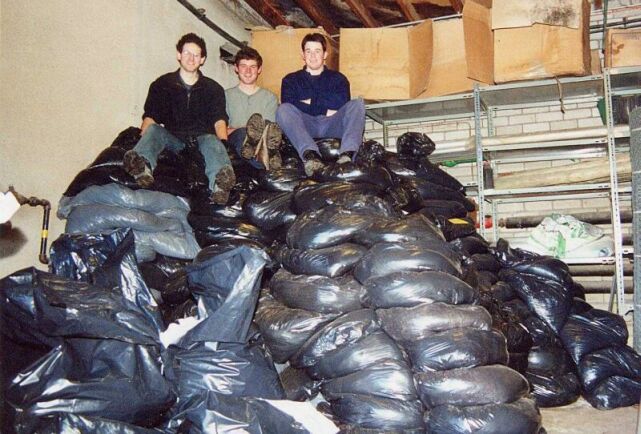 Months later ... The soil has been processed.
In other words, thousands of little pieces
of paper from the disintegrated
paper lining of the plastic bags have
been picked out.
Paper is made from C3
plant material and would therefore have interfered
with our measurements of carbon fluxes
into the soil.
All that soil had to be thoroughly mixed
to make sure we were using the same substrate
in the entire experiment.
Months later ... The soil has been processed.
In other words, thousands of little pieces
of paper from the disintegrated
paper lining of the plastic bags have
been picked out.
Paper is made from C3
plant material and would therefore have interfered
with our measurements of carbon fluxes
into the soil.
All that soil had to be thoroughly mixed
to make sure we were using the same substrate
in the entire experiment.
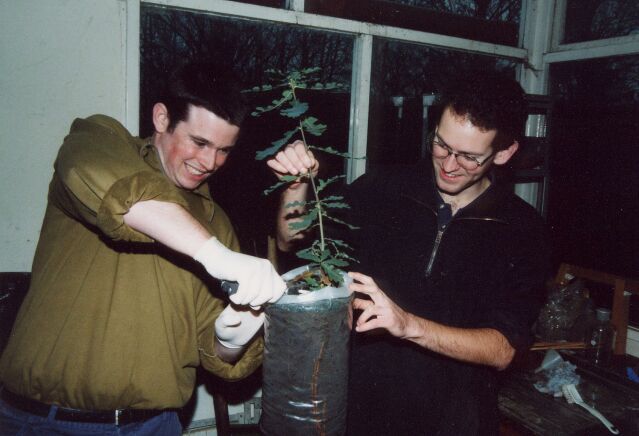
Trees grow in associations with fungi,
called mycorrhizas.
Before starting the experiment, we had
to inoculate our soil with mycorriza
collected from stands of the different
tree species.
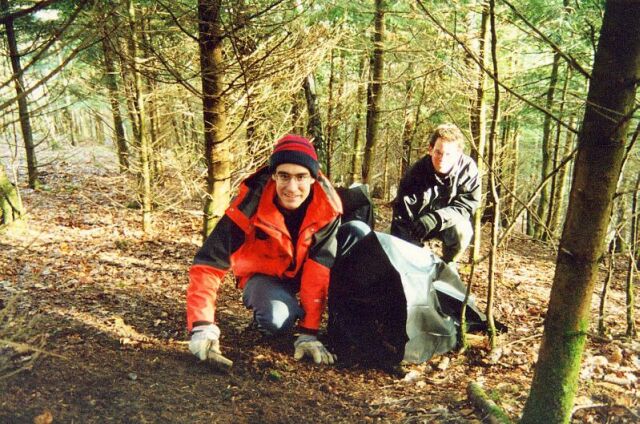
 Nothing much to see here, but then most
of the interesting stuff lives in the soil.
As we wanted to follow the fate of plant
material in the soil food web,
the soil used in the experiment was also
inoculated with microfauna
(such as nematodes
and microarthropods)
and extracted from soil cores taken in the field.
Nothing much to see here, but then most
of the interesting stuff lives in the soil.
As we wanted to follow the fate of plant
material in the soil food web,
the soil used in the experiment was also
inoculated with microfauna
(such as nematodes
and microarthropods)
and extracted from soil cores taken in the field.
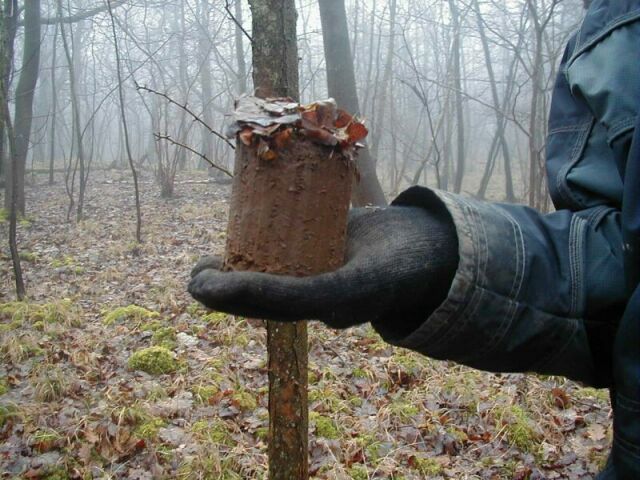
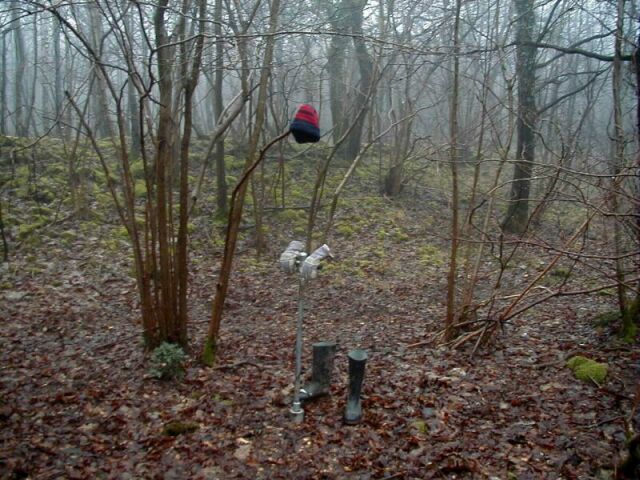
Cores such as this one ...
 ... and the other 7499, waiting to be
extracted (as seen here).
... and the other 7499, waiting to be
extracted (as seen here).
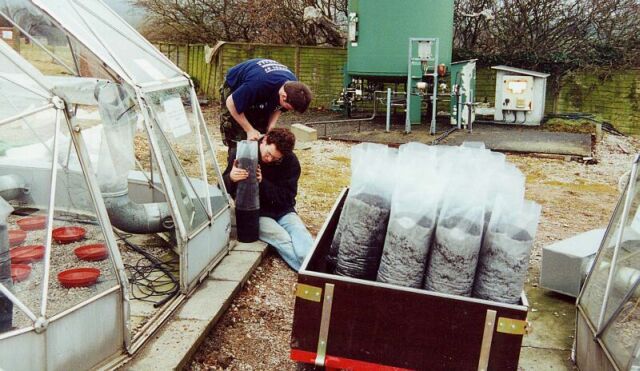
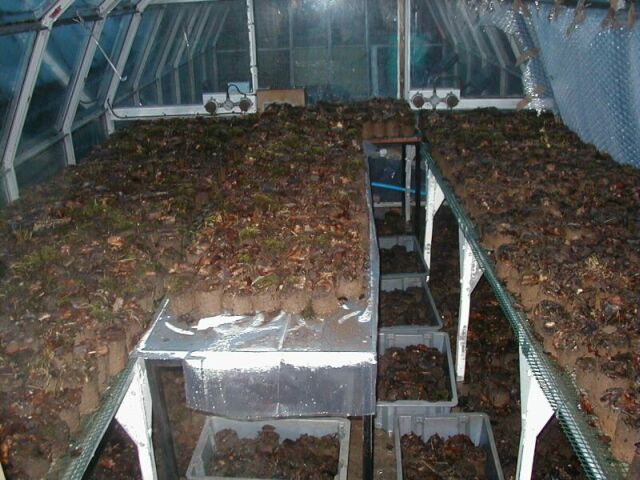
Late winter 2001. The first containers
for our 504 plants are being filled
and put into the Solardomes,
the special greenhouses used for this experiment.
The containers are home-made plastic sleeves,
which allow the plants to put down deep roots.
If trees are grown in containers that
are too shallow, root growth may be restricted
and this can have unforeseen consequences
for the growth of the entire plant.
We are using six species, a relatively
early-successional (pioneer) species
and a relatively late-successional (shade-tolerant)
species each from three plant families:
oak
(Quercus robur) and beech
(Fagus sylvatica),
birch
(Betula pendula) and hornbeam
(Carpinus betulus), and
pine
(Pinus sylvestris) and fir
(Abies alba).
The species are expected
to show different responses to the elevated CO2 concentrations.
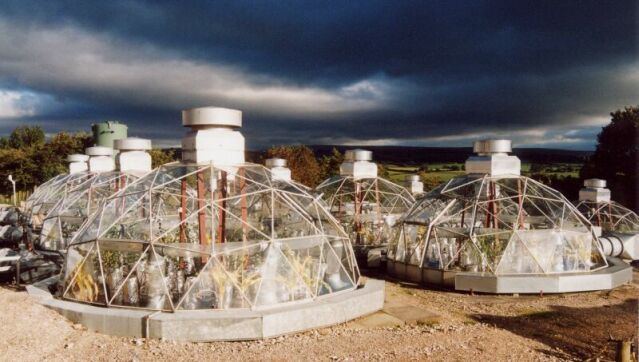
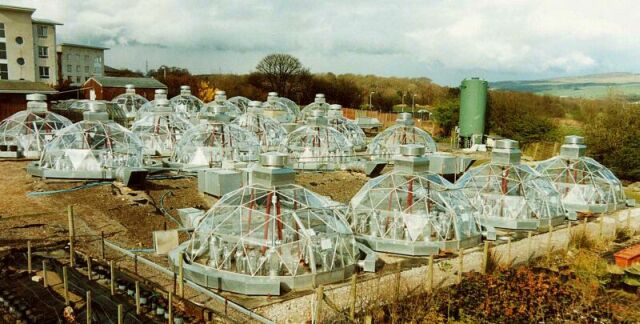 Spring 2001. The experiment is carried
out in an array
of 12 Solardomes.
Four different CO2
concentrations are replicated in three Solardomes each:
ambient, ambient plus 100 ppm, ambient
plus 200 ppm, and ambient plus 300 ppm CO2.
The plants are grown at two levels of
nutrient availability to test
how this variable affects their responses
to the elevated CO2 concentrations.
The green tank in the background contains
CO2 that is added
to the air in the elevated-CO2
treatments.
Spring 2001. The experiment is carried
out in an array
of 12 Solardomes.
Four different CO2
concentrations are replicated in three Solardomes each:
ambient, ambient plus 100 ppm, ambient
plus 200 ppm, and ambient plus 300 ppm CO2.
The plants are grown at two levels of
nutrient availability to test
how this variable affects their responses
to the elevated CO2 concentrations.
The green tank in the background contains
CO2 that is added
to the air in the elevated-CO2
treatments.
The global CO2 concentration
keeps
rising, but nobody can be sure
which concentration the world will have
reached by the end of this century.
It is, however, very likely that it will
be somewhere in the range we are employing.
At intervals during the experiment and
at the end, the carbon isotope ratios (C-12/C-13)
of the soil, the plants and the organisms
in the soil are analysed
to find out how much carbon has gone
into the soil,
whether the amount correlates with the
growth rates of our different tree species
in the different CO2
concentrations and nutrient levels,
and what has happened to the carbon in
the soil.
First, the shoots are detached from the
roots, then roots are separated from the soil,
and finally the fauna is extracted from
the soil.
The different fractions are dried, weighed
and ground up for the analyses.
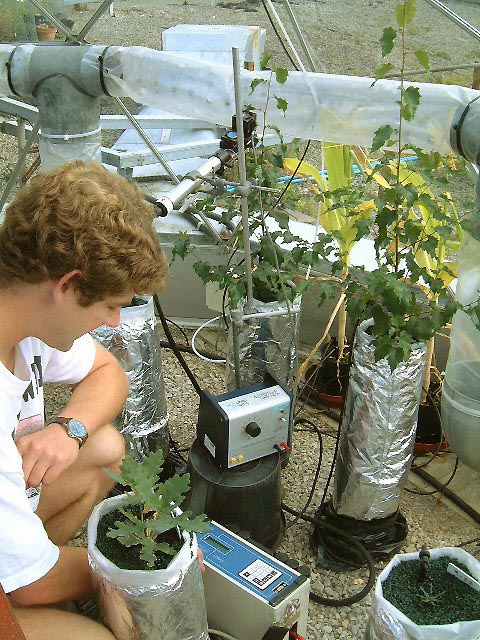
The carbon isotope ratio measurements
are complemented by a range
of physiological investigations such
as the determination of
photosynthesis and transpiration rates
shown here.
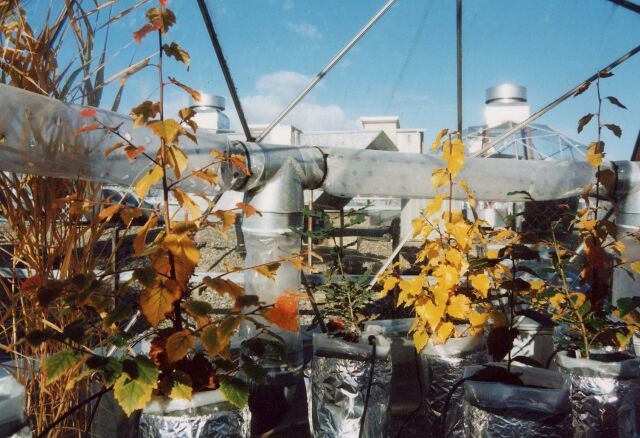
Autumn 2001.
The first season is over, and the plants
will be grown for a second one in 2002.
© University of Lancaster 2002. ALL RIGHTS RESERVED.
Last updated on 24/01/2002 by G. Kerstiens.